This statistic outlines the market capitalization of selected agricultural chemical companies worldwide as of November 2019. At that time, Nutrien had a market capitalization of some 28.5 billion U.S. dollars.
Market capitalization of selected agricultural chemical companies worldwide in November 2019 (in million U.S. dollars)
Basic Account
Get to know the platform
You only have access to basic statistics.
This statistic is not included in your account.
Starter Account
The ideal entry-level account for individual users
- Instant access to 1m statistics
- Download in XLS, PDF & PNG format
- Detailed references
$199 USD / Month *
Professional Account
Full access
Business Solutions including all features.
* Prices do not include sales tax.
Other statistics that may interest you Monsanto-Bayer
Overview
4
- Premium Statistic Global leading chemical companies based on market capitalization 2023
- Premium Statistic 
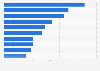
Market cap of selected agricultural chemical companies worldwide 2019
- Premium Statistic Bayer and Monsanto merger - selected data 2016
- Premium Statistic Bayer's acquisition offers to Monsanto May-September 2016
Financials: Bayer
7
- Premium Statistic Bayer Group's net sales 2021-2023 by segment
- Premium Statistic Bayer Group's net income 1995-2023
- Basic Statistic Bayer Group's total assets 2009-2023
- Basic Statistic Bayer Group's number of employees 2009-2023
- Premium Statistic Bayer AG's top pharmaceutical products based on revenue 2021-2023
- Basic Statistic Bayer CropScience's revenue 2005-2023
- Basic Statistic Bayer HealthCare's revenue 2005-2018
Financials: Monsanto
7
- Premium Statistic Monsanto's net income 2011-2017
- Premium Statistic EBIT of Monsanto 2011-2017
- Basic Statistic Monsanto's R&D expenditure 2008-2017
- Premium Statistic Monsanto's net sales 2008-2017
- Basic Statistic Monsanto's total assets 2008-2017
- Basic Statistic Monsanto's seed and genomics segment net sales 2011-2017
- Basic Statistic Monsanto's net sales in the agricultural productivity segment 2011-2017
Competitors
8
- Premium Statistic Leading companies worldwide 2021, based on pesticide sales
- Premium Statistic 2023 list of global top 10 biotech and pharmaceutical companies based on revenue
- Basic Statistic Pharma company ranking by governance of access in developing countries 2022
- Basic Statistic Pharma company ranking based on R&D for developing countries 2022
- Basic Statistic Pharma company ranking based on market influence in developing countries 2018
- Basic Statistic Pharma company ranking based on access to medicine in developing countries 2022
- Premium Statistic 2023 list of global top 10 biotech and pharmaceutical companies based on net income
- Premium Statistic Top 50 pharmaceutical companies - Rx sales and R&D spending 2022
Further related statistics
15
- Market cap of selected specialty materials companies worldwide 2019
- Market cap of leading chemical distribution and services companies worldwide 2019
- Market capitalization of leading diversified chemical companies worldwide 2019
- Revenue of leading chemical distribution and services companies worldwide 2016
- Capacity of leading bio-succinic acid producers worldwide 2016
- Market share of third party chemical distribution companies worldwide by region 2012
- Market size of third party chemical distribution worldwide by region 2012
- Leading chemical and petrochemical companies in Brazil 2021, by net revenue
- Net revenue of chemical company Unipar Carbocloro in Brazil 2013-2022
- Leading global materials sector companies market capitalization 2023
- Argentina's leading chemical companies 2019-2021, by index score
- Leading polyether polyol producers worldwide by capacity 2016
- Changes in R&D spending of the top U.S. chemical companies 2011
- Changes in agricultural chemistry expenditure of U.S. farms 2009-2011
- Global chemical companies' year-over-year change in sales Q2 2020
Further Content: You might find this interesting as well
Statistics
- Market cap of selected specialty materials companies worldwide 2019
- Market cap of leading chemical distribution and services companies worldwide 2019
- Market capitalization of leading diversified chemical companies worldwide 2019
- Revenue of leading chemical distribution and services companies worldwide 2016
- Capacity of leading bio-succinic acid producers worldwide 2016
- Market share of third party chemical distribution companies worldwide by region 2012
- Market size of third party chemical distribution worldwide by region 2012
- Leading chemical and petrochemical companies in Brazil 2021, by net revenue
- Net revenue of chemical company Unipar Carbocloro in Brazil 2013-2022
- Leading global materials sector companies market capitalization 2023
- Argentina's leading chemical companies 2019-2021, by index score
- Leading polyether polyol producers worldwide by capacity 2016
- Changes in R&D spending of the top U.S. chemical companies 2011
- Changes in agricultural chemistry expenditure of U.S. farms 2009-2011
- Global chemical companies' year-over-year change in sales Q2 2020
Harris Williams. (November 30, 2019). Market capitalization of selected agricultural chemical companies worldwide in November 2019 (in million U.S. dollars) [Graph]. In Statista. Retrieved May 04, 2024, from https://www.statista.com/statistics/690629/market-capitalization-of-agrochemical-companies-worldwide/
Harris Williams. "Market capitalization of selected agricultural chemical companies worldwide in November 2019 (in million U.S. dollars)." Chart. November 30, 2019. Statista. Accessed May 04, 2024. https://www.statista.com/statistics/690629/market-capitalization-of-agrochemical-companies-worldwide/
Harris Williams. (2019). Market capitalization of selected agricultural chemical companies worldwide in November 2019 (in million U.S. dollars). Statista. Statista Inc.. Accessed: May 04, 2024. https://www.statista.com/statistics/690629/market-capitalization-of-agrochemical-companies-worldwide/
Harris Williams. "Market Capitalization of Selected Agricultural Chemical Companies Worldwide in November 2019 (in Million U.S. Dollars)." Statista, Statista Inc., 30 Nov 2019, https://www.statista.com/statistics/690629/market-capitalization-of-agrochemical-companies-worldwide/
Harris Williams, Market capitalization of selected agricultural chemical companies worldwide in November 2019 (in million U.S. dollars) Statista, https://www.statista.com/statistics/690629/market-capitalization-of-agrochemical-companies-worldwide/ (last visited May 04, 2024)
Market capitalization of selected agricultural chemical companies worldwide in November 2019 (in million U.S. dollars) [Graph], Harris Williams, November 30, 2019. [Online]. Available: https://www.statista.com/statistics/690629/market-capitalization-of-agrochemical-companies-worldwide/