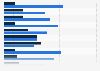
This statistic shows the number of working elderly people in Hong Kong from 2010 to 2019, by age group. In 2019, approximately 43,900 elders aged 70 and above had a job in Hong Kong, whereas around 109,700 people aged 65 to 69 years participated in the labor force.
Number of working elderly people in Hong Kong from 2010 to 2019, by age group (in 1,000s)
Basic Account
Get to know the platform
You only have access to basic statistics.
This statistic is not included in your account.
Starter Account
The ideal entry-level account for individual users
- Instant access to 1m statistics
- Download in XLS, PDF & PNG format
- Detailed references
$199 USD / Month *
Professional Account
Full access
Business Solutions including all features.
* Prices do not include sales tax.
Other statistics that may interest you Statistics on
About the industry
10
- Premium Statistic Elderly people labor force participation rate in Hong Kong 2010-2019, by age group
- Basic Statistic Elderly population dependency ratio in Italy 2012-2024
- Premium Statistic Underemployment rate in Hong Kong 2013-2023
- Basic Statistic Share of permanent full-time and part-time employees in Finland 2013-2023
- Premium Statistic Hong Kong's female share in labor force 2012-2022
- Premium Statistic Median weekly earnings of the foreign born population by age U.S. 2020
- Premium Statistic Foreign born workers' earnings as a share of native born earnings U.S. 2019-20
- Premium Statistic Median weekly earnings of foreign born population by gender U.S. 2019-20
- Premium Statistic Median weekly earnings of native and foreign born workers by education U.S. 2020
- Premium Statistic Informal employment share in Tunisia Q4 2019, by sector
About the region
10
- Premium Statistic Share of elderly people in domestic households in Hong Kong 2010-2020
- Premium Statistic Number of elderly population in domestic households Hong Kong 2010-2020, by age group
- Premium Statistic Number of households with older people in Hong Kong 2010-2020, by type
- Premium Statistic Share of households with older people in Hong Kong 2010-2020
- Premium Statistic Hong Kong's children and old-age dependency ratio 1980-2022
- Premium Statistic Average household size in Hong Kong 2000-2023
- Premium Statistic Share of single-person households in Hong Kong 2000-2023
- Premium Statistic Perceived and actual share of population over 65 years by 2050 in Hong Kong 2018
- Premium Statistic Number of employees in Hong Kong's cultural and creative industries 2011-2021
- Premium Statistic Number of employees in Hong Kong's entertainment services 2011-2021
Other regions
10
- Basic Statistic Population in Taiwan 2013-2023, by broad age group
- Premium Statistic Single-person households share South Korea 1995-2022
- Premium Statistic Centenarians among the French population January 2016, by gender
- Basic Statistic Elderly UK population projection 2020-2050 by age group
- Premium Statistic Economically active population in Algeria 2010-2019
- Basic Statistic Population forecast of Finland 2021-2070, by age group
- Basic Statistic Population aged 80 and older in China 1950-2100
- Premium Statistic Worker population ratio in rural and urban India 2015
- Basic Statistic U.S. population share of Texas 2022, by age group
- Basic Statistic Age structure in Syria 2022
Related statistics
10
- Premium Statistic Number of employees in Hong Kong's performing arts industry 2011-2021
- Premium Statistic Number of employees in Hong Kong's design industry 2011-2021
- Premium Statistic Number of employees in Hong Kong's software industry 2011-2021
- Premium Statistic Number of employees in Hong Kong's television and radio industry 2011-2021
- Premium Statistic Number of employees in Hong Kong's film, video and music industry 2011-2021
- Premium Statistic Fertility rate in Hong Kong 2000-2023
- Premium Statistic Number of domestic households in Hong Kong 2013-2023
- Premium Statistic Total workforce in Hong Kong 2013-2023
- Premium Statistic Number of people employed in Hong Kong's social services industry 2013-2023
- Premium Statistic Number of people employed in Hong Kong's manufacturing industry 2013-2023
Further related statistics
8
- Number of employees of Church & Dwight worldwide 2009-2023
- Assets of financial institutions in Hong Kong 2012-2022, by institution type
- Ocean Park Hong Kong theme park attendance 2009-2022
- Mobile internet use via laptops in Great Britain 2019, by demographic
- Reading frequency of book consumers in France 2017, by age
- Number of independent artists, writers and performers in the U.S. 2000-2013
- Estimated annual profits from forced labor 2012, by region & type
- Married U.S. adults in 1960 and 2010
Further Content: You might find this interesting as well
Statistics
- Number of employees of Church & Dwight worldwide 2009-2023
- Assets of financial institutions in Hong Kong 2012-2022, by institution type
- Ocean Park Hong Kong theme park attendance 2009-2022
- Mobile internet use via laptops in Great Britain 2019, by demographic
- Reading frequency of book consumers in France 2017, by age
- Number of independent artists, writers and performers in the U.S. 2000-2013
- Estimated annual profits from forced labor 2012, by region & type
- Married U.S. adults in 1960 and 2010
Census and Statistics Department Hong Kong. (December 23, 2020). Number of working elderly people in Hong Kong from 2010 to 2019, by age group (in 1,000s) [Graph]. In Statista. Retrieved May 19, 2024, from https://www.statista.com/statistics/962367/hong-kong-number-of-working-elderly-people/
Census and Statistics Department Hong Kong. "Number of working elderly people in Hong Kong from 2010 to 2019, by age group (in 1,000s)." Chart. December 23, 2020. Statista. Accessed May 19, 2024. https://www.statista.com/statistics/962367/hong-kong-number-of-working-elderly-people/
Census and Statistics Department Hong Kong. (2020). Number of working elderly people in Hong Kong from 2010 to 2019, by age group (in 1,000s). Statista. Statista Inc.. Accessed: May 19, 2024. https://www.statista.com/statistics/962367/hong-kong-number-of-working-elderly-people/
Census and Statistics Department Hong Kong. "Number of Working Elderly People in Hong Kong from 2010 to 2019, by Age Group (in 1,000s)." Statista, Statista Inc., 23 Dec 2020, https://www.statista.com/statistics/962367/hong-kong-number-of-working-elderly-people/
Census and Statistics Department Hong Kong, Number of working elderly people in Hong Kong from 2010 to 2019, by age group (in 1,000s) Statista, https://www.statista.com/statistics/962367/hong-kong-number-of-working-elderly-people/ (last visited May 19, 2024)
Number of working elderly people in Hong Kong from 2010 to 2019, by age group (in 1,000s) [Graph], Census and Statistics Department Hong Kong, December 23, 2020. [Online]. Available: https://www.statista.com/statistics/962367/hong-kong-number-of-working-elderly-people/