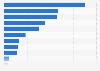
This statistic represents the distribution of silver powder production by major countries from 2011 to 2016, with a forecast for 2017. In 2011, the U.S. produced around 68 percent of the silver powder produced worldwide, and by 2016, the production share was lowered to 40 percent.
Distribution of annual silver powder production by country from 2011 to 2017
Basic Account
Get to know the platform
You only have access to basic statistics.
This statistic is not included in your account.
Starter Account
The ideal entry-level account for individual users
- Instant access to 1m statistics
- Download in XLS, PDF & PNG format
- Detailed references
$199 USD / Month *
Professional Account
Full access
Business Solutions including all features.
* Prices do not include sales tax.
Other statistics that may interest you Statistics on
About the industry
10
- Premium Statistic World physical silver demand change by sector 2017
- Premium Statistic World physical silver demand change percentage by sector 2017
- Premium Statistic World silver demand annual change by industrial application 2016
- Premium Statistic World silver demand distribution by sector 2004 and 2014
- Basic Statistic Distribution of global silver production 2023, by primary source metal
- Basic Statistic Annual silver production of Fresnillo 2010-2022
- Premium Statistic Global silver supply distribution by source 2014
- Premium Statistic Global silver demand 2010-2023
- Premium Statistic Share of palladium production worldwide 2022, by mining company
- Premium Statistic Global rhodium supply 2010-2023, by region
About the region
7
- Basic Statistic Pan American Silver's production by metal 2018-2022
- Premium Statistic Top countries in raisin production 2022/23
- Premium Statistic Share of the global vegetable exports value 2011-2015, by leading country
- Premium Statistic Global moringa export share by region 2015
- Premium Statistic Global refined copper consumption distribution 2022, by region
- Basic Statistic Distribution of primary nickel consumption worldwide 2022, by industry
- Premium Statistic Distribution of platinum production worldwide by producer 2022
Selected statistics
3
Other regions
10
- Premium Statistic Demand for industrial silver in India 2012-2023
- Premium Statistic Germany: monthly value of precious metal imports 2017
- Premium Statistic Production of electrolytic copper in Poland 2014-2023
- Premium Statistic Distribution of nickel consumption in China by industry 2014
- Premium Statistic Colombia: gold production volume in 2017, by region
- Premium Statistic Johnson Matthey global revenue from precious metal products 2012-2017
- Premium Statistic Ireland: monthly value of precious metal imports 2017
- Basic Statistic Production basic metals and metal products industry in the Netherlands 2005-2015
- Premium Statistic Turkey: monthly value of precious metal exports 2017-2018
- Premium Statistic Production of silver in Canada by province 2022
Related statistics
10
- Premium Statistic Global refined zinc production and consumption 2012-2022
- Premium Statistic Global demand for platinum 2005-2023
- Premium Statistic Global platinum demand for jewelry by region 2015-2023
- Premium Statistic Global recycled platinum 2010-2023, by former use
- Premium Statistic Global ruthenium demand 2010-2023
- Premium Statistic Global rhodium demand by industry 2010-2023
- Premium Statistic Global iridium demand 2010-2023
- Premium Statistic Global rhodium demand 2010-2023
- Premium Statistic Global iridium demand 2017-2023, by application
- Premium Statistic Global ruthenium demand 2017-2023, by application
Further related statistics
10
- Biofuels related jobs worldwide by region 2019
- The adidas Group's global footwear production from 2008-2023
- Number of people working in fishing and aquaculture worldwide 1995-2020
- Global oil production share 2022, by country
- Global natural gas production in oil equivalent 1998-2019
- Global pharmaceutical pipeline by therapy area 2013-2017
- Global ITO and BPO - Value of industrywide contracts 2012
- Focus areas of U.S. employer's health care strategies 2013
- Information technology outsourcing market by function 2006-2011
- Global leading silver consumers 2010
Further Content: You might find this interesting as well
Statistics
- Biofuels related jobs worldwide by region 2019
- The adidas Group's global footwear production from 2008-2023
- Number of people working in fishing and aquaculture worldwide 1995-2020
- Global oil production share 2022, by country
- Global natural gas production in oil equivalent 1998-2019
- Global pharmaceutical pipeline by therapy area 2013-2017
- Global ITO and BPO - Value of industrywide contracts 2012
- Focus areas of U.S. employer's health care strategies 2013
- Information technology outsourcing market by function 2006-2011
- Global leading silver consumers 2010
The Silver Institute. (November 15, 2017). Distribution of annual silver powder production by country from 2011 to 2017 [Graph]. In Statista. Retrieved May 01, 2024, from https://www.statista.com/statistics/495555/share-of-global-silver-powder-production-by-country/
The Silver Institute. "Distribution of annual silver powder production by country from 2011 to 2017." Chart. November 15, 2017. Statista. Accessed May 01, 2024. https://www.statista.com/statistics/495555/share-of-global-silver-powder-production-by-country/
The Silver Institute. (2017). Distribution of annual silver powder production by country from 2011 to 2017. Statista. Statista Inc.. Accessed: May 01, 2024. https://www.statista.com/statistics/495555/share-of-global-silver-powder-production-by-country/
The Silver Institute. "Distribution of Annual Silver Powder Production by Country from 2011 to 2017." Statista, Statista Inc., 15 Nov 2017, https://www.statista.com/statistics/495555/share-of-global-silver-powder-production-by-country/
The Silver Institute, Distribution of annual silver powder production by country from 2011 to 2017 Statista, https://www.statista.com/statistics/495555/share-of-global-silver-powder-production-by-country/ (last visited May 01, 2024)
Distribution of annual silver powder production by country from 2011 to 2017 [Graph], The Silver Institute, November 15, 2017. [Online]. Available: https://www.statista.com/statistics/495555/share-of-global-silver-powder-production-by-country/