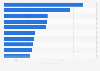
From January to March 2021, users worldwide averaged 3.22 pages visited every time they accessed YouTube.com from any kind of device. In the examined period, the number of pages visited in one session has decreased by more than 40 percent compared to the corresponding period in the previous year. As the beginning of 2021, users visiting the platform's website via mobile tended to visit more pages, resulting in an average of 4.63 pages per visit from mobile devices. In the case of users accessing the website from desktop devices, the number of pages visited decreased to 2.84 per session.
Number of pages visited per session on YouTube worldwide from January to March 2021, by device
Basic Account
Get to know the platform
You only have access to basic statistics.
This statistic is not included in your account.
Starter Account
The ideal entry-level account for individual users
- Instant access to 1m statistics
- Download in XLS, PDF & PNG format
- Detailed references
$199 USD / Month *
Professional Account
Full access
Business Solutions including all features.
* Prices do not include sales tax.
Other statistics that may interest you Statistics on
About the industry
10
- Premium Statistic Italy: Facebook videos optimal length 2018
- Premium Statistic Italy: YouTube videos optimal length 2018
- Premium Statistic Italy: preferred online videos 2018, by type
- Premium Statistic Distribution of YouTube users in the United Kingdom 2021, by gender
- Basic Statistic YouTube: Leading channels in Angola 2021, by number of video views
- Premium Statistic Most popular educational institutions on YouTube in Finland 2020, by video views
- Basic Statistic Canada share of mothers watching YouTube 2016, by age group
- Basic Statistic Canada reasons why moms watch YouTube videos in Canada in 2016
- Basic Statistic YouTube penetration in selected countries and territories 2024
- Basic Statistic All-time most viewed YouTube channel owners 2024
About the region
10
- Premium Statistic Yearly TikTok MAU growth worldwide 2021, by region
- Premium Statistic Netflix's quarterly net income 2013-2024
- Basic Statistic Share of videos removed from YouTube worldwide 2019-2023, by reason
- Basic Statistic YouTube: most viewed channels 2024
- Basic Statistic Countries with the most YouTube users 2024
- Premium Statistic Highest-earning YouTube stars 2023
- Basic Statistic Fastest viral videos based on number of views in 24 hours as of 2022
- Basic Statistic Most popular YouTube videos published in 2019, by number of views
- Basic Statistic Most popular Facebook videos published in 2019, by number of views
- Basic Statistic Average YouTube video length 2018, by category
Other regions
9
- Basic Statistic Legal video services market revenue share in Russia 2019-2022, by segment
- Premium Statistic Italy: usage of sound playing on Facebook videos 2018, by age group
- Premium Statistic Leading YouTube search queries in France 2023
- Premium Statistic Comparison of television usage and online video usage in China in 2011, by age
- Basic Statistic Leading interactions while watching YouTube videos according to Canadian mothers 2016
- Premium Statistic Internet users paying for digital content subscriptions in the Middle East 2016
- Premium Statistic Share of internet users who paid for online content in the Middle East by method 2016
- Basic Statistic Mexico: most viewed YouTubers 2018
- Premium Statistic Colombia: most influential YouTubers 2018
Related statistics
10
- Basic Statistic U.S. registered YouTube user reach 2022, by household income
- Basic Statistic Use of online video services (such as YouTube) in Belgium 2016-2021, by region
- Basic Statistic Use of online video services (such as YouTube) in Belgium 2016-2021, by age
- Basic Statistic Use of online video services (such as YouTube) in Belgium 2016-2021, by gender
- Basic Statistic YouTube usage frequency in the United States 2020
- Basic Statistic Online video service (such as YouTube) use in Wallonia (Belgium) 2016-2019, by gender
- Basic Statistic Online video service (such as YouTube) use in Brussels (Belgium) 2016-2019, by gender
- Basic Statistic Online video service (such as YouTube) use in Flanders (Belgium) 2016-2019, by age
- Basic Statistic Online video service (such as YouTube) use in Wallonia (Belgium) 2016-2019, by age
- Basic Statistic Online video service (such as YouTube) use in Flanders (Belgium) 2016-2019, by gender
Further related statistics
10
- Netflix's annual revenue 2002-2023
- E-mail messaging penetration in Great Britain 2007-2020
- Reasons for using social media to get a customer service response 2012
- Social network usage for news access worldwide 2019-2023
- Comparison of cobalt consumption in the U.S. 2010-2023
- U.S. mobile wireless MOUs 2005-2021
- Minutes per day spent watching broadcast TV in the UK 2010-2022, by age
- Social network profile creation in the UK 2010-2020, by socio-economic group
- Number of TV households in the UK 2010-2019, by platform
- Daily U.S. water withdrawals by category 2015
Further Content: You might find this interesting as well
Statistics
- Netflix's annual revenue 2002-2023
- E-mail messaging penetration in Great Britain 2007-2020
- Reasons for using social media to get a customer service response 2012
- Social network usage for news access worldwide 2019-2023
- Comparison of cobalt consumption in the U.S. 2010-2023
- U.S. mobile wireless MOUs 2005-2021
- Minutes per day spent watching broadcast TV in the UK 2010-2022, by age
- Social network profile creation in the UK 2010-2020, by socio-economic group
- Number of TV households in the UK 2010-2019, by platform
- Daily U.S. water withdrawals by category 2015
Semrush. (August 2, 2021). Number of pages visited per session on YouTube worldwide from January to March 2021, by device [Graph]. In Statista. Retrieved May 21, 2024, from https://www.statista.com/statistics/1257273/pages-per-visit-youtubecom-by-device/
Semrush. "Number of pages visited per session on YouTube worldwide from January to March 2021, by device." Chart. August 2, 2021. Statista. Accessed May 21, 2024. https://www.statista.com/statistics/1257273/pages-per-visit-youtubecom-by-device/
Semrush. (2021). Number of pages visited per session on YouTube worldwide from January to March 2021, by device. Statista. Statista Inc.. Accessed: May 21, 2024. https://www.statista.com/statistics/1257273/pages-per-visit-youtubecom-by-device/
Semrush. "Number of Pages Visited per Session on Youtube Worldwide from January to March 2021, by Device." Statista, Statista Inc., 2 Aug 2021, https://www.statista.com/statistics/1257273/pages-per-visit-youtubecom-by-device/
Semrush, Number of pages visited per session on YouTube worldwide from January to March 2021, by device Statista, https://www.statista.com/statistics/1257273/pages-per-visit-youtubecom-by-device/ (last visited May 21, 2024)
Number of pages visited per session on YouTube worldwide from January to March 2021, by device [Graph], Semrush, August 2, 2021. [Online]. Available: https://www.statista.com/statistics/1257273/pages-per-visit-youtubecom-by-device/