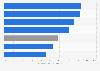
Infocus Mekong in 2020, around 20 percent of households in urban areas of Vietnam had an income from 25,000,000 to 29,999,999 Vietnamese dong. Meanwhile, one percent of them stated to have an income of under 4,990,000 Vietnamese dong.
As surveyed by Percentage distribution of household income in urban areas in Vietnam in 2020
Basic Account
Get to know the platform
You only have access to basic statistics.
This statistic is not included in your account.
Starter Account
The ideal entry-level account for individual users
- Instant access to 1m statistics
- Download in XLS, PDF & PNG format
- Detailed references
$199 USD / Month *
Professional Account
Full access
Business Solutions including all features.
* Prices do not include sales tax.
Other statistics that may interest you Statistics on
About the industry
10
- Premium Statistic Share of dual-earner families South Korea 2013-2022
- Basic Statistic Sources of income for households in South Africa 2019
- Premium Statistic Share of dual-earner families South Korea 2018, by age of children
- Premium Statistic Share of dual-earner families South Korea 2018, by number of children
- Premium Statistic Italy: percentage change in median disposable household income 1991-2010
- Premium Statistic Share of average monthly income in two-earner households India 2015
- Premium Statistic Share of average monthly income in three-earner households India 2015
- Premium Statistic Average monthly earnings - salary worker households in India 2015
- Premium Statistic Average monthly income share of self-employed Indians 2015
- Premium Statistic Average monthly income share of regular wage Indians 2015
About the region
10
- Premium Statistic Value growth of FMCG categories in urban cities in Vietnam 2022
- Premium Statistic Ownership of digital devices in urban areas in Vietnam 2020, by type
- Premium Statistic Share of urban buyers purchasing fabric softener in Vietnam 2015-2019
- Premium Statistic Share of urban buyers purchasing toilet cleaners in Vietnam 2015-2019
- Premium Statistic Share of urban buyers purchasing added value detergent in Vietnam 2015-2019, by type
- Premium Statistic Share of urban buyers buying added value fabric softener Vietnam 2015-2019, by type
- Premium Statistic Ownership of bank cards in urban and rural households in Vietnam 2018, by type
- Premium Statistic Share of urban buyers purchasing added value dish soap in Vietnam 2015-2019, by type
- Premium Statistic Ownership of cars among urban and rural households in Vietnam 2018, by type
- Premium Statistic Share of food private label products among urban buyers in Vietnam 2017-2019
Other regions
10
- Premium Statistic Household net adjusted income of European countries 2019
- Premium Statistic Mean annual household disposable income in the United Kingdom 2000-2019
- Basic Statistic Impact of COVID-19 on family businesses income in Tunisia 2020
- Premium Statistic Distribution of annual household income South Africa 2010
- Basic Statistic Countries ranked by median self-reported household income, 2006 - 2012
- Basic Statistic Problems with housing in Great Britain (United Kingdom) 2014, by income band
- Basic Statistic Average monthly food and non-food consumption per adult in Tanzania 2017-2018
- Premium Statistic Annual disposable income of households in the Netherlands 2017, by household type
- Premium Statistic London: sources of income for working households in 2015/16, by source
- Basic Statistic Poverty line for households in Italy 2022
Related statistics
10
- Premium Statistic Share of urban buyers purchasing fabric detergent in Vietnam 2015-2019, by category
- Premium Statistic Share of personal care private label products among urban buyers in Vietnam 2017-2019
- Premium Statistic Share of home care private label products among urban buyers in Vietnam 2017-2019
- Premium Statistic Monthly average income per capita in Ho Chi Minh City Vietnam 2010-2022
- Premium Statistic Monthly average income per capita in Da Nang Vietnam 2010-2022
- Premium Statistic Monthly average income per capita in Vietnam 2022, by quintile
- Premium Statistic Monthly average income per capita in Can Tho Vietnam 2010-2022
- Premium Statistic Monthly average income per capita in urban areas in Vietnam 2022, by quintile
- Premium Statistic Monthly average income per capita in Hai Phong Vietnam 2010-2022
- Premium Statistic Monthly average income per capita in rural areas in Vietnam 2022, by quintile
Further related statistics
10
- Internet user distribution in China 2012-2023, by urban and rural region
- Operating income of Dine Brands Global worldwide 2008-2023
- Net income of Dine Brands Global worldwide 2008-2023
- First Solar's net income FY 2007-2023
- Operating income of Papa John's worldwide 2007-2023
- Net income of Papa John's worldwide 2007-2023
- Operating income of Tripadvisor worldwide 2008-2023
- Net income of Tripadvisor worldwide 2008-2023
- Global net earnings of the Brunswick Corporation 2007-2023
- Not-for-profit theaters earned income via single ticket sales in the U.S. 2018-2022
Further Content: You might find this interesting as well
Statistics
- Internet user distribution in China 2012-2023, by urban and rural region
- Operating income of Dine Brands Global worldwide 2008-2023
- Net income of Dine Brands Global worldwide 2008-2023
- First Solar's net income FY 2007-2023
- Operating income of Papa John's worldwide 2007-2023
- Net income of Papa John's worldwide 2007-2023
- Operating income of Tripadvisor worldwide 2008-2023
- Net income of Tripadvisor worldwide 2008-2023
- Global net earnings of the Brunswick Corporation 2007-2023
- Not-for-profit theaters earned income via single ticket sales in the U.S. 2018-2022
Infocus Mekong. (March 30, 2021). Percentage distribution of household income in urban areas in Vietnam in 2020 [Graph]. In Statista. Retrieved May 13, 2024, from https://www.statista.com/statistics/1227949/vietnam-household-income-distribution-in-urban-areas/
Infocus Mekong. "Percentage distribution of household income in urban areas in Vietnam in 2020." Chart. March 30, 2021. Statista. Accessed May 13, 2024. https://www.statista.com/statistics/1227949/vietnam-household-income-distribution-in-urban-areas/
Infocus Mekong. (2021). Percentage distribution of household income in urban areas in Vietnam in 2020. Statista. Statista Inc.. Accessed: May 13, 2024. https://www.statista.com/statistics/1227949/vietnam-household-income-distribution-in-urban-areas/
Infocus Mekong. "Percentage Distribution of Household Income in Urban Areas in Vietnam in 2020." Statista, Statista Inc., 30 Mar 2021, https://www.statista.com/statistics/1227949/vietnam-household-income-distribution-in-urban-areas/
Infocus Mekong, Percentage distribution of household income in urban areas in Vietnam in 2020 Statista, https://www.statista.com/statistics/1227949/vietnam-household-income-distribution-in-urban-areas/ (last visited May 13, 2024)
Percentage distribution of household income in urban areas in Vietnam in 2020 [Graph], Infocus Mekong, March 30, 2021. [Online]. Available: https://www.statista.com/statistics/1227949/vietnam-household-income-distribution-in-urban-areas/