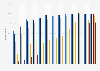
Purchases made through e-payments India 2022, by age group
According to a survey conducted by Rakuten Insight in October 2022, over 82 percent of respondents above 35 years of age stated to have used e-payment methods for paying bills. Overall, a larger share of younger Indians used e-payment services for wide-ranging purchases including paying for real-world services like transportation or even to split bills with others when dining out.