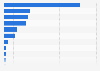
In the third quarter of fiscal year 2022, the volume for Titan company's watch products was 21 percent, down from 67 percent in the second quarter of the same fiscal year. Titan Company Limited is a luxury products company based in India that specializes in fashion accessories such as jewelry, watches, and eyewear.
Titan watches quarterly volume change between financial year 2017 and 2022
Basic Account
Get to know the platform
You only have access to basic statistics.
This statistic is not included in your account.
Starter Account
The ideal entry-level account for individual users
- Instant access to 1m statistics
- Download in XLS, PDF & PNG format
- Detailed references
$199 USD / Month *
Professional Account
Full access
Business Solutions including all features.
* Prices do not include sales tax.
Other statistics that may interest you Statistics on
About the industry
10
- Premium Statistic Titan Company's quarterly net sales of watch segment Q1 FY 2017-Q3 FY 2024
- Premium Statistic Titan Company's watch segment EBIT margin Q1 FY 2017-Q3 FY 2024
- Premium Statistic Titan Company's watch segment EBIT Q1 FY 2017-Q3 FY 2024
- Premium Statistic Titan Company's jewelry segment EBIT Q1 FY 2017-Q3 FY 2024
- Premium Statistic Titan Company's income from watches FY 2015-2023
- Premium Statistic Titan Company's watch segment EBIT FY 2015-2023
- Premium Statistic Global consumers' preferred sales channel to purchase a watch 2017
- Premium Statistic Global consumers' planned watch purchase in the next 24 months as of 2017
- Premium Statistic Watch and jewelry retail sales value index in Great Britain 2011-2022
- Premium Statistic Watch and jewelry retail sales volume index in Great Britain 2011-2022
About the region
10
- Premium Statistic Titan Company's profit before tax FY 2015-2023
- Basic Statistic EBIT of Godrej Consumer Products FY 2015-2023
- Premium Statistic Reserves to debt ratio in India FY 2015-2023
- Premium Statistic Primary deficit as a percent of GDP in India FY 2011-2024
- Premium Statistic Revenue deficit as a percent of GDP in India FY 2015-2024
- Premium Statistic Primary revenue deficit as a percent of GDP in India FY 2011-2024
- Premium Statistic Taxes on commodities and services in India FY 2013-2023
- Premium Statistic Invisible balance to GDP ratio in India FY 2015-2023
- Premium Statistic Total export and import of goods to GDP ratio in India FY 2015-2023
- Premium Statistic Outstanding liabilities deficit as a percent of GDP in India FY 2011-2024
Selected statistics
5
- Basic Statistic John Lewis Partnership: number of employees in the United Kingdom (UK) 2009-2023
- Basic Statistic John Lewis sales revenue in the United Kingdom (UK) 2009-2023
- Basic Statistic Number of Nike stores globally 2009-2023
- Premium Statistic John Lewis online sales growth in the United Kingdom (UK) 2011-2018
- Premium Statistic John Lewis online sales in the United Kingdom (UK) 2011-2016
Other regions
9
- Premium Statistic Clock & watch market size South Korea 2013-2022
- Premium Statistic Total watch and clock export value from Hong Kong 2014-2020
- Premium Statistic Revenue of retail sale of watches & jewelry in specialized stores in Italy 2010-2020
- Premium Statistic Share of Japanese consumers who bought fake branded goods 2016
- Premium Statistic Leading wristwatch brands in Great Britain 2020, by number of users
- Premium Statistic Per capita spending on watches and clocks in the Netherlands 2015-2022
- Premium Statistic Number of enterprises specialized in selling watches & jewelry in Turkey 2009-2022
- Premium Statistic Retail sales index of watches & jewelry in Denmark 2018-2023
- Basic Statistic Net sales of the Fossil Group in the United States from 2015 to 2022
Related statistics
10
- Premium Statistic Hindustan Unilever's reserves and surplus value FY 2013-2023
- Premium Statistic Annual growth rate of merchandise exports in India FY 2015-2023
- Premium Statistic Hindustan Unilever's gross sales value FY 2013-2023
- Premium Statistic Annual growth rate of merchandise imports in India FY 2015-2023
- Premium Statistic Trade balance to GDP ratio in India FY 2015-2023
- Premium Statistic Hindustan Unilever's market capitalization FY 2013-2023
- Premium Statistic Hindustan Unilever's share price in BSE FY 2013-2023
- Premium Statistic Hindustan Unilever's return on net worth FY 2013-2023
- Premium Statistic Hindustan Unilever's return on capital employed FY 2013-2023
- Premium Statistic Hindustan Unilever's investment value FY 2013-2023
Further related statistics
10
- John Lewis: number of stores in the United Kingdom (UK) 2009-2023
- Waitrose sales revenue in the United Kingdom (UK) 2009-2023
- Number of Waitrose stores in the United Kingdom (UK) 2009-2023
- Tesco's sales worldwide 2016/2017-2022/2023, by region
- Return on average common shareholder equity at Goldman Sachs 2009-2023
- Net interest income of Deutsche Bank 2006-2023
- Net revenue from investment banking at Goldman Sachs 2009-2023
- Total number of shares issued by Allianz Group 2009-2023
- Structure of investment portfolio of Allianz Group 2014-2023
- Shareholders equity at Allianz Group 2008-2023
Further Content: You might find this interesting as well
Statistics
- John Lewis: number of stores in the United Kingdom (UK) 2009-2023
- Waitrose sales revenue in the United Kingdom (UK) 2009-2023
- Number of Waitrose stores in the United Kingdom (UK) 2009-2023
- Tesco's sales worldwide 2016/2017-2022/2023, by region
- Return on average common shareholder equity at Goldman Sachs 2009-2023
- Net interest income of Deutsche Bank 2006-2023
- Net revenue from investment banking at Goldman Sachs 2009-2023
- Total number of shares issued by Allianz Group 2009-2023
- Structure of investment portfolio of Allianz Group 2014-2023
- Shareholders equity at Allianz Group 2008-2023
Titan Company. (February 3, 2022). Titan watches quarterly volume change between financial year 2017 and 2022 [Graph]. In Statista. Retrieved May 11, 2024, from https://www.statista.com/statistics/1008696/india-titan-watches-volume-growth/
Titan Company. "Titan watches quarterly volume change between financial year 2017 and 2022." Chart. February 3, 2022. Statista. Accessed May 11, 2024. https://www.statista.com/statistics/1008696/india-titan-watches-volume-growth/
Titan Company. (2022). Titan watches quarterly volume change between financial year 2017 and 2022. Statista. Statista Inc.. Accessed: May 11, 2024. https://www.statista.com/statistics/1008696/india-titan-watches-volume-growth/
Titan Company. "Titan Watches Quarterly Volume Change between Financial Year 2017 and 2022." Statista, Statista Inc., 3 Feb 2022, https://www.statista.com/statistics/1008696/india-titan-watches-volume-growth/
Titan Company, Titan watches quarterly volume change between financial year 2017 and 2022 Statista, https://www.statista.com/statistics/1008696/india-titan-watches-volume-growth/ (last visited May 11, 2024)
Titan watches quarterly volume change between financial year 2017 and 2022 [Graph], Titan Company, February 3, 2022. [Online]. Available: https://www.statista.com/statistics/1008696/india-titan-watches-volume-growth/